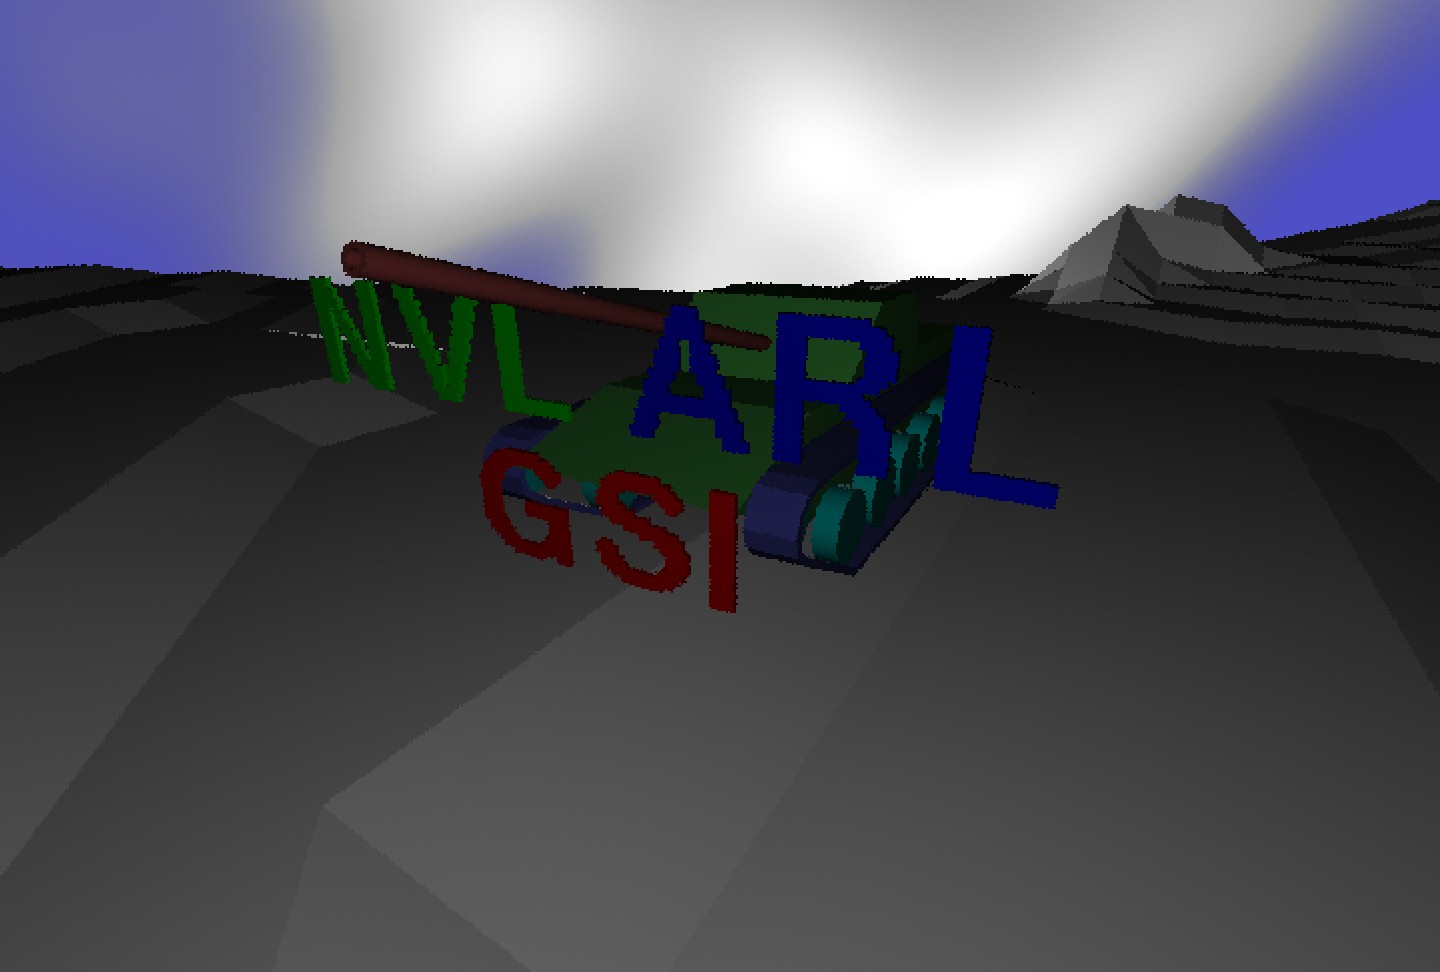
 Plate 1. Ray-Traced Height Field With K-Tank
                     Michael John Muuss

           Leader, Advanced Computer Systems Team
      Survivability and Lethality Analysis Directorate
             The U.S. Army Research Laboratory
                  APG, MD  21005-5068  USA
                      <Mike @ ARL.MIL>


                       Maximo Lorenzo

            Project Leader, DIS Simulation Group
      Night Vision and Electronic Sensors Directorate
               10221 Brubeck Road, Suite 430
              Ft. Belvoir, VA  22060-5806  USA
                  <Lorenzo @ NVL.ARMY.MIL>
(A fully-formatted PostScript version of this paper is available.)
Modern missiles utilize multiple sensors to locate their targets. This paper describes a project to produce a physically accurate digital simulation of all sensor inputs for the missile's automatic target recognizer in real time, with image quality equal to that of real military sensors. The approach taken is to combine highly detailed terrain, tree, vegetation, and man-made structure models, highly detailed target geometry, and highly detailed target signature modeling, using ray-tracing to interrogate the scene. The simulations employed will be as true to the underlying physics of the situation as is possible.
In order to approach real-time performance, the initial system is being implemented using an 8-node, 96-processor Silicon Graphics Incorporated (SGI) Power Challenge Array, with a peak system performance of over 28 billion floating point operations per second (28 GFLOPS). The goal is to produce five television-resolution frames per second simultaneously in three spectral bands: optical, thermal, and radar.
The primary goal is to produce real-time imagery for the development and testing of missile automatic target recognition (ATR) systems. This work also addresses one of the pressing needs of the Defense Interactive Simulation (DIS) community by providing the ability to add a physically accu- rate high-resolution multispectral signature gen- eration node to a distributed simulation when new sensor technology needs to be explored.
Presented at the BRL-CAD Symposium '95, 6-June-1995. Published in Proceedings of BRL-CAD Symposium '95 Aberdeen Proving Ground, MD, 5-9 June 1995.
Modern missiles utilize multiple sensors to locate their targets. Traditional sensor simulation has been done using a scale model "terrain board," with sensors mounted on a robotic boom. For second generation Forward Looking Infra-Red (FLIR), millimeter-wave radar (MMW), laser radar (LADAR), and other advanced sensors, terrain board models do not provide real-world dynamics for either the platform or the target, nor do they permit simultaneous multifrequency signature generation. Because the sensor's view changes instant-to-instant depending on the flight decisions made by the missile guidance system or remote operator, the only alternative to firing real missiles is computer simulation [DER92].
The ultimate goal for this project is the physically accurate digital simulation of all sensor inputs for the weapon's Automatic Target Recognizer (ATR) in real time, with image quality equal to that of real military sensors. To accomplish such accurate simulation requires highly detailed terrain, tree, vegetation, and man-made structure models, highly detailed target geometry, highly detailed target signature modeling, and high-speed processing. The architecture of this real-time high-resolution multispectral interactive signature generation system is shown in Figure 1.
                Vehicle DBTerrain & Vegrmal Mesh
                   |         |          |
                   |         |          |
               Target MotionImage & Signature Generator
                Simulation  Scene Thermal Simulation
                        |  |     |       |
                 +------+  |     |       |
               | |  |  |   ||  | |  |  | |  |
               | Pos|& |OpticalThermal |Radar
               |Orient |   ||  | |  |  | |  |
                 |         |     |       |
                 |        Missile ATR or Human Operator
                 |               |
                 +--------       |
                          Guidance & Dynamics Simulation

                      Figure 1. System architecture.
The two candidate technologies for image generation in real time are polygon rendering and ray-tracing. In polygon rendering, the geometry of the scene is expressed as a series of polygons with "texture" patterns painted on them. These polygons are transformed using a simple viewing frustum [FOLE84] broken into scanline-oriented spans and written into dual-ported random access memory (RAM). This is the approach used in all high-performance graphics workstations and all present-day commercial visual simulators, including flight simulators. With polygon rendering, many important effects can not be simulated, including reflection and refraction effects in the scene (e.g., "glints," mirror reflections, "mirages," air/water interfaces, etc.), geometric distortions due to lenses, frequency-specific distortions in lenses ("chromatic aberrations"), and many atmospheric effects, especially those involving participating media (clouds, obscurants, "beams of sunlight," etc.). Sensor transfer function and scanning effects can only be addressed by adding outboard signal processing hardware to "post process" the polygon rendering, as first demonstrated by the highly successful "Paint the Night" system [LORE95a].
State-of-the-art systems are still sharply limited in terms of the level of geometric complexity that can be in view at once; "a few million" polygons a second is the current limit. Even exploiting texture mapped polygons to the fullest, the complexity of the scene is severely restricted, making a sense of "visual richness" difficult to achieve. While limited realism is perfectly acceptable for simulations used to conduct soldier/tactics training, it is inadequate for the needs of fairly assessing the technical performance of competing sensor designs. Modern military sensors capture a tremendous amount of resolution and can be very sensitive to minute details in the scene. The primary advantage of polygon-based scene generation is that it relies on rapidly advancing commercial workstation technology, but there is a limit to growth, as polygon rendering is not amenable to large-scale parallelization [CROW86] using current commercial architectures. Only the PixelPlanes, PixelPowers, and PixelFlow family of rendering hardware from The University of North Carolina [POUL85, GOLD86] offer the eventual hope of highly parallelizeable polygon rendering.
By comparison, the ray-tracing approach is free from all the limitations of the polygon rendering approach, at the price of requiring a horrifyingly larger amount of computation. In this age of increasingly practical parallel processors, the price may not be too high to pay. Ray- tracing is an "embarrassingly parallel" algorithm; algorithm performance scales linearly as the number of processors is increased. Actual measured performance for parallel implementations routinely achieve better than 93% efficiency [MUUS87d]. In the limit, one processor could be purchased for each image pixel to be generated. Fortunately this extreme is not necessary, as modern microprocessors can deliver from hundreds to tens of thousands of rays per second, depending on model [MUUS88a]. Thus, the primary advantage of ray-tracing based scene generation is that it takes full advantage of the tremendous power of commercial parallel processing systems. These systems are being propelled forward by the rapidly advancing commercial microprocessor chip technology such that within five years this level of processing power will be found on large ``departmental'' sized super-workstations at one tenth the cost of our current system.
The ray-tracing approach to image generation also addresses all the difficult issues in signature generation. Ray-tracing has long been known for its ease of handling reflection and refraction [WHIT80]. The ray trajectory for each pixel is individually determined, allowing geometric distortions to be handled with no extra computation. While not trivial to implement, atmospheric effects can also be well addressed with ray-tracing [SHIR91]. The one main limitation of the ray-tracing approach is the difficulty in handling diffuse inter-reflection. This is an especially important effect in indoor settings with indirect lighting. The Department of Energy has developed algorithms to add this effect to ray-traced rendering [WARD94] but it imposes a substantial computational burden.
Ray-tracing addresses the physical effects needed for high-resolution sensor simulation. Ray-tracing-based algorithms impose no impediment to fully parallel implementation, ensuring that only hardware cost and not technology barriers control the speed of image generation. This allows users with semi-real-time applications to purchase less expensive scene generation hardware than the configuration needed for real-time applications, while still utilizing exactly the same software, geometry, and sensor models. Furthermore, price will be directly and smoothly linked to performance; twice the money will buy twice the performance.
The U. S. Army Ballistic Research Laboratory Computer Aided Design Package (BRL-CAD) is the U. S. Army's third generation solid modeling system [MUUS83, MUUS87a, MUUS91b]. It is government-owned software written entirely in the C programming language [KERN78]. BRL-CAD includes a fully parallelized ray-tracing library and support for fault- tolerant network distributed ray-tracing.
A collection of combinatorial solid geometric (CSG) models of hundreds of military vehicles, both foreign and domestic, already exists in BRL-CAD form [APPL94]. These geometric models are all Government owned and ready for immediate inclusion into ATR test scenarios [DEIT88]. While polygon-based simulators deem any model over 200 polygons as "high resolution," the BRL-CAD targets are modeled using about 1,000 CSG solids (10,000-20,000 polygon equivalents), and high resolution BRL-CAD targets range in complexity from 5,000 CSG solids to 40,000 CSG solids (800,000 polygon equivalents).
Many existing signature prediction codes are already interfaced to and layered on top of the BRL-CAD software, greatly improving the opportunities for partnering and software reuse.
This project has three separable portions which are proceeding in parallel.
A combination of hardware and software techniques will be employed to produce ray-traced renderings of models of enormous complexity in near-real-time, with the goal being to achieve performance of five NTSC-resolution (720 pixels, 486 active scanlines) [CONR80] frames per second [MUUS95b]. To achieve this high rate of image production, a very substantial amount of processor power is required. The initial system is being implemented using an 8-node, 96-processor Silicon Graphics Incorporated (SGI) Power Challenge Array, depicted in Figure 2.
                     10 Mbit/sec Ethernet|
                -+------+--------+-------+--
                 |      |        |       |
                 |      |        |
                Node 0 Node 1   Node 7  Control
                                        1 CPU
                12 CPUs12 CPUs  12 CPUs
                 | |    |        |
                 | -------------+-
                 |  800 Mbit/sec|HIPPI
                ||  |           |       HIPPI
                |Disk           +-------Frame-
                Array                   Buffer

                     Figure 2.  Hardware architecture.
Each node has 2 Gbytes of 8-way interleaved RAM and 12 MIPS, Inc. R8000 processors running at 75 MHz. Each of these processors is capable of up to 300 million floating point operations per second (300 MFLOPS), for a system total of over 28 billion floating point operations per second (28 GFLOPS).
The BRL-CAD network-distributed ray-tracer remrt [MUUS87d] will serve as the starting point for this effort, with the first extension being the real-time synchronization of direct framebuffer output, rather than having each processor returning results to the remrt work dispatcher.
Once all processors are operating in synchrony, various software optimizations will be implemented. Some optimizations will be targeted at using even less computationally expensive algorithms inside the BRL-CAD LIBRT ray-tracing library, while other optimizations will be targeted at improving system memory access patterns and reducing the cache "footprint" of the software to better utilize the available processing power of the hardware, while still other optimizations will focus on reducing the overall memory demand, so that still larger models can be crammed into the available RAM memory.
One of the first such modifications to be made to the stock BRL-CAD Release 4.4 software will be in the area of the handling of instances. At present, LIBRT fully elaborates every instance of a prototype object, preferring the increased memory use from having an individual copy of each prototype "prepped" and optimized for its orientation and location in space, as opposed to paying the increased computational expense of transforming each ray into the local coordinate system of the prototype. In the case of the trees, this is not a practical tradeoff, as creating tens of thousands of instances of trees each comprised of thousands of solids produces an explosive and needless increase in memory consumption. A flag will be added to the database so that the model-builder may indicate whether the instance should be optimized for speed or for space, and a new set of algorithms will be added to LIBRT to support this alternative interpretation of the instance operation.
It is worth noting that for this project it is assumed that the entire scene database will fit into the 2 Gbytes of RAM in each node shown in Figure 2, and that the entire database will be replicated across all nodes. No attempt will be made to fragment different portions of the the scene into different nodes.
To get this project started using a realistically large and detailed environment, a terrain data file was acquired from the TEXCOM element at Fort Hunter-Liggett, covering a 12-Km x 16-Km rectangle of land, with the data given at 1-m intervals, in pvdb format.* Each data point includes the height of the ground above sea level, a monochrome pixel of optical data, and several bits of information about ground cover, vegetation, and man-made artifacts. This data was separated out into a mosaic of BRL-CAD height-field (HF) solids, with a matching mosaic of BRL-CAD bw(4) format image files. A simple shell script generated a BRL-CAD geometry database (".g" file) that referred to all the individual HF solids and applied the corresponding bw(4) image file as a "bwtexture" texture map. An example of the ray-traced images produced at this stage of development is included as Plate 1.
* The height measurements were taken from a lower resolution contour map, so this isn't "really" 1-m resolution terrain. However, the overlays are genuine 1-m data.
The next phase of the project was to add geometric trees to the database. A collection of seven prototype trees (alder, birch, pine, and four styles of oak) that had been produced by John Dome for an earlier effort [DER92] were carefully merged into a single BRL-CAD database ("trees.g"), suitable for use as prototypes for instancing. Each tree was composed of about 2000 BRL-CAD particle solids (see Figure 3) to form the trunk and branches, and 1200 BRL- CAD extruded-bit-map (EBM) solids for each leaf, grown using carefully controlled algorithms [AONO84].
                 +------+------------------+
                 |Tree  | Particles   EBMs |
                 +------+------------------+
                 |Pine  |   2497      1749 |
                 |Alder |   1745       852 |
                 |Birch |   3634      1605 |
                 |Oak1  |   1954      1176 |
                 |Oak2  |   2240      1206 |
                 |Oak3  |   1940      1044 |
                 |Oak4  |   1695       963 |
                 +------+------------------+

          Figure 3. Tree complexity in CSG solids.
The overlay data that came with the original HF data set had a special marker to indicate the presence of a tree trunk at that location. However, the elevation data in the vicinity was inconsistent. Over most portions of the terrain, the "height-above-sea-level" value includes the height of the vegetation, so that trees appear as tall local "bumps" in the land surface. In certain portions of the the original data, the "height above sea level" value was not disturbed by the presence of trees, even though the optical overlay and the "tree trunk" bit definitely indicated the presence of a tree.
For our purposes, this second type of tree treatment was perfect. We identified a rectangle of land where none of the trees affected the height measurement of the terrain, and Chris Johnson wrote a program [JOHN95] to extract the coordinates of all the marked tree trunks. This table of tree locations was then fed into a shell script which, for each tree, randomly selected the type of tree and its rotation (twist) around the vertical (+Z) axis, added a uniformly distributed random tilt of +/-15 degrees off of vertical, and then output an MGED command sequence to place an instance of the selected tree into the BRL-CAD database.
Restricting ourselves to adding trees to a small 250-m- square area in the midst of the full 192-million-point (16000 x 12000) height field, the overall complexity of the scene when rendered was about 500,000-CSG solids, making this the largest database rendered with BRL-CAD to date. Plate 2 shows the front of the grove of trees, complete with shadows. Plate 3 shows a location towards the rear of the grove of trees. Note that the shadow of the Tomahawk missile has entered the field of view (FOV) in this image.
However the task is far from complete. Most importantly, the tree "lumps" need to be eliminated from the HF data, so that the entire landscape can be properly populated with trees, not just a small region. This will require a special program to be written, along with extensive hand-checking. Having 192 Km2 of terrain with geometric trees everywhere natural trees exist will create new software and data management challenges in efficiently handling geometry databases of approximately 50,000,000-CSG solids. The equivalent polygon count of such a scene approaches 1 billion polygons.
Procedural noise [EBER94] will be used to add realistic bark to the trees without additional geometric complexity [BUTL95]. Similarly, a greater variety of extruded bitmaps for the leaves will be constructed, and they too will have appropriate noise added to provide a realistic leaf-like texture to the surface of the leaves.
One-meter spacing for the terrain data is fine when viewed from far away, but when flying close to the surface of the earth, the 1-m x 1-m squares of terrain are quite distracting -- a tank or truck only covers a few such squares. What is needed is additional detail, to "fill in the gaps" between the 1-m samples. Procedural detail is the most storage efficient source for such detail, as a very small number of coefficients can be used to drive the procedure. In order to be true to the physics of the situation, a "ground surface type" code will be assigned to each sample point on the terrain, indicating whether the surface is dirt, short grass, tall grass, a plowed field, asphalt, stone, etc. These surface-type codes will be determined as accurately as possible using all available data about the Fort Hunter-Liggett area, perhaps including vegetation data from NASA satellites. CECOM/NVESD has on file careful statistical analyses of the measured thermal and optical properties of many different samples of real soil.
Thus, when a ray intersects the terrain, the local terrain type will be used to retrieve the statistical properties of that type of terrain from the database of measurements, and those measurements will be used to filter a noise field with randomization parameters anchored to the spatial coordinates of the original samples (Figure 4). This will produce random detail in the terrain that has the same statistical properties as is seen in real soil of the same type.
              |    |    |    |    |    |
              |    |    |    |    |    |
              |Terrain  |Ground   |Ground
              |    |    |    |    |Statistics
                |         |         |
                |         |         |
                |         |         |
               Ground Return Synthesis AlgoPixel

               Figure 4. Terrain detail synthesis process.
The existing BRL-CAD optical lighting module does a nice job of producing optical images. No additional work should be necessary to use it for this simulation, other than to properly match the actual sensor's FOV and any geometric distortions due to the optics.
For early prototype purposes, rather than starting by using a full-fledged synthetic aperture radar (SAR) code such as XPATCH [ANDE94] or SRIM [ARNO87], a pseudo-radar approximation will be employed, utilizing a special variation of the optical model which treats all metal components of the target as a pure reflector, with a light source (transmit antenna) located coincident to the eye location (receive antenna). The resulting image gives a good visualization of the primary scattering centers of the target and accounts for multibounce effects. As soon as is practical, this will be replaced with a more rigorous SAR calculation to generate the returned complex energy field.
Calculating the thermal image is going to be the most development-intensive aspect of this project. For early prototype purposes, the color optical image was converted to monochrome and run through a ``quick and dirty'' first- generation FLIR sensor effects algorithm [MOUL95]. This algorithm incorporated the bi-directional scanning pattern and the AC coupling effect of the sensor, and then added a 10-frame left/right/left line-correlated noise sequence in a continuous rolling pattern, producing images with system noise properties bearing a striking resemblance to what would be observed on the display of a genuine military FLIR.
The next step will be to stop using the optical image as a base and to instead associate temperature values with each object in the scene. Then the scene radiance can be sampled using ray-tracing, a distance attenuation factor can be incorporated, and then the sensor effects can be applied, as before. A high-resolution BRL-CAD model of the Soviet T62 tank* has been carefully modified so that every region has an appropriate temperature associated with it. Real sensor data has been used to prepare a tree thermal texture- map for the trees. For each section of the terrain, a surface-type code is stored which indicates the type of surface (sand, hard-packed earth, plowed field, short grass, tall grass, rock, etc.). Measurements have been made of representative areas of each surface type and processed to extract the statistical properties of the real material. As in the optical case described earlier, a random noise field will be filtered to achieve those same statistical properties and then will be superimposed upon the terrain HF to procedurally determine the temperature of each hit on the ground. The transfer function of any sensor described in the FLIR92 package can then be applied to the resulting radiance map to produce a thermal image.
* Geometry courtesy of our CRDA partner, Geometric Solutions Incorporated, 100 Custis St., Aberdeen, MD 21001, telephone 410-273-7058.
Once all these new software elements are all combined, the generated thermal image will have the high resolution demanded by modern sensors, produced by physically-based computation of most of the significant effects. Being able to fly through this scene in real time will be quite a breakthrough. However, one major limitation remains: the scene lacks thermal dynamics. While vehicles may maneuver and the sun will move in a realistic manner, the temperatures in the scene will not change. To address this limitation, a follow-on project is planned, whereby a thermal nodal model (unstructured mesh) is automatically generated for the geometry of the scene, and temperature transport throughout the scene is computed, accounting for convection, conduction, radiation, and solar loading. The use of thermal textures on the trees will be replaced with predictive tree thermal models. The associativity of the thermal mesh will be dynamically modified as vehicles maneuver, and heating of the ground due to contact with hot tracks and exhaust plumes will be handled with (at least) a simplified atmospheric model. The details of this follow-on project are the topic for another paper.
By uniting the three different signature prediction codes into one multispectral prediction code, a substantial efficiency gain is possible. For that area where the FOV of the three sensors overlaps, each main ``eye visibility'' ray fired from the sensor location into the scene can be reused for all spectral bands. Once the ray strikes an object, additional rays may be needed to compute wavelength- dependent effects, including reflection and reflection. Similarly, one ``sun visibility'' ray can be used both for shadow generation in the optical model and in the solar loading calculation for the thermal model. This synergistic sharing of computational expense between the different spectral models should result in a modest but significant savings and a commensurate improvement in interactivity.
Initially, target vehicles (tanks, trucks, mobile missile launchers, etc.) will be statically placed in the scene. However, assuming that the targets are instanced into the scene using the nonelaborated (storage efficient) option described above, it will be trivial to replace the transformation matrices which position the targets in the scene, assuming that there is some outboard scenario or DIS- style simulator [LORE95b] providing motion paths for those vehicles.
At that point, the natural next step is to integrate the physically accurate vehicle dynamics codes HITPRO [HARE92] and IWAVM [PREN90] into the simulation, as was done to create the videotape ``Virtual Wheels: A Suspension of Reality'' [BUTL93]. Those codes require terrain height information and maneuver commands as input and produce as output the displacements of each road wheel relative to the hull, the hull roll and pitch angles relative to the ground, and the gun angle -- including highly accurate simulation of the gun stabilization system, if desired. The details of this interfacing are depicted in Figure 5. Having accurately modeled high-resolution targets with physics- based motion will add an unprecedented level of detail and realism to the simulation.
As a by-product of this project, the system can be used as a DIS-compatible digital scene simulator of stupendous fidelity. While this level of accuracy would not usually be called for in most SIMNET applications, there are opportunities early in the research and development cycle where it would be advantageous to allow soldiers to experience the performance of sensors and ATR algorithms which have not yet been built. This project will permit such experiences to be gained.
               Scenario   Terrain M1 Geometry
                     \            |
                    Dynamics    Terrain
                   Simulation   Builder
                       |      /      \
                       |     /        \
                    Angles &           M1 &
                    Positions         Terrain
                    /    |    \          |
                Camera  Track  Hull      |
                    \      |    /        |
                     \     |   /         v
                      Articulation--->Rendering
                        Script

               Figure 5. Integrating maneuvering, articulated targets.
By pursuing these three portions of the project in parallel, it will be possible to convey the ``feel'' of the finished system partway through the project. The signature prediction software can be run non-interactively, storing the output sequences of images onto video-disk for subsequent full-speed playback. This will allow the quality of the signature prediction algorithms to be inspected carefully early in the process, ensuring that time won't be wasted optimizing code which doesn't give acceptable results. Similarly, it will be possible to ``fly around'' in ray-traced renderings of simplified geometry early in the project, ensuring that timing and synchronization details, head-tracker installation and calibration, and user- interface issues have all been ironed out well before the first ``full up'' demonstrations.
The implementation of this project is still in its infancy. However, already a number of videotapes have been produced to document the progress to date, including: ``First Quick Height-Field Animation,'' ``K-Tank on Texture Mapped Height Field,'' ``BRL-CAD: Geometry Support for Predictive Signature Calculations,'' ``Tomahawk Missile Flight,'' and ``Optical and IR Missile Sensor Simulation for ATR: Preliminary Results.'' These videotapes were not produced in realtime. Individual frames were computed into disk files, transferred to an Abekas A60 D-1 digital video disk, and then recorded onto Betacam-SP master tapes [KENN91].
The first missile sequence was computed using 18 R8000 processors and achieved an output frame rate better than one frame every 30 clock seconds. The final tape included the grove of trees as well as an articulated missile and sun visibility rays, and on a system with 12 R8000 processors, produced an output frame roughly every 30 clock minutes. Clearly the factor of 60 slowdown is not due only to the decreased number of processors. The extreme size of the database (roughly 500,000 solids) resulted in a working set of 1.8 Gbytes of RAM. It is not yet known how much of this performance loss is due to processor page table management overhead and memory bus contention, and how much can be attributed to algorithmic problems associated with such a gargantuan geometry file. For a more detailed discussion about the performance and optimization plans, please refer to the companion paper [MUUS95b].
The authors would like to thank Dr. Paul Deitz for providing his unflagging support and encouragement and for providing an environment that makes good research possible. The authors would also like to thank our CRDA partner Geometric Solutions Inc. for being such good team-mates on this project, contributing both their time and their enthusiasm.
We would also like to thank Phil Dykstra, Paul Stay, and Chuck Kennedy for their efforts over a 2-year period to obtain the Array computer to support exactly this kind of DOD project. And finally we would like to thank Sandor Der, John Dome, Russ Moulton, Dave Walthall, John Horger, Mark Smith, and Clare Walters for having the collective vision to lay the groundwork for this project more than 5 years ago.
This work was supported in part by a grant of HPC time from the DOD HPC Shared Resource Center at the U.S. Army Research Laboratory on the Silicon Graphics, Inc. PowerChallenge Array computer.
Plate 1. Ray-Traced Height Field With K-Tank
 Plate 2. Ray-Traced Grove of Trees, With Shadows.
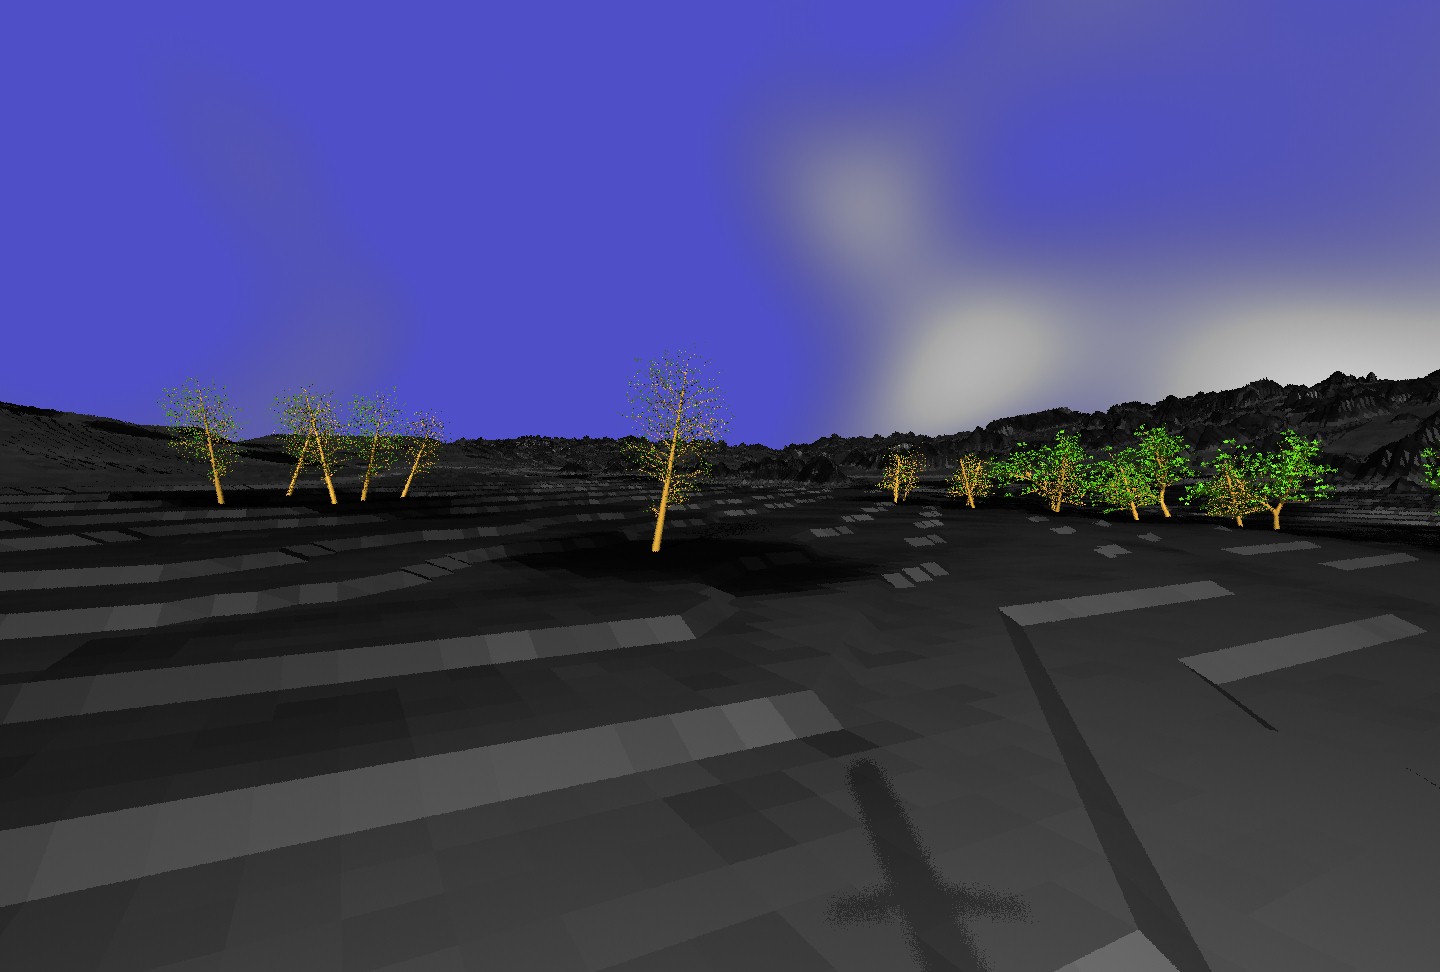 Plate 3. Ray-Traced Trees, Showing Shadow of Missile.